Any transition from one layout model to another requires to call abstractMixedGraph::Layout_ConvertModel() which does some kind of garbage collection for the old layout points and sets the correct display parameters for the new model. When calling a layout method, this is done implicitly. There may be various drawing methods supporting the same layout model!
In the very basic setting, the straight line model, graph drawing just means to position the graph nodes in the Euclidian plane. But this only works with simple graphs (graphs without parallel edges and loops). Node and arc labels are placed according to certain global rules. It is obvious that such rules produce readable drawings without overlaps only in special cases.
The are several drawing methods which produce straight line drawings, for example placement of all nodes on a circle or exposing a predecessor tree. The resulting drawings may be input to a force directed placement (FDP) method. The latter do not always produce straight line drawings but call sparseRepresentation::Layout_ArcRouting() in order to expose possible parallel edges.
The more elaborate layout models require to distinguish between graph nodes and layout points. The latter are addressed by node indices ranged in an interval [0,1,..,n+ni-1]. All graph nodes are mapped to layout points, called node anchor points. The additional layout points can be grouped as follows:
For the time being, graph node indices and the respective node anchor point indices coincide, that is NodeAnchorPoint(v)==v.
Depending on the applied layout model, these nodes are either implicit or represented by a layout node index and respective coordinates:
Provided that the number of control points is generally bounded, use sparseRepresentation::GetArcControlPoints() to write the control point sequence of a specified arc to aa array, including the port nodes. The result depends on the arc orientation bit. If the number of control points is not known in advance, the sequence of control points of any forward arc a (an even arc index!) is obtained by this recurrency rule:
controlPoint[0] = PortNode(a);
for (i=0;controlPoint[i]!=NoNode;++i) { controlPoint[i+1] = ThreadSuccessor(controlPoint[i]); }
If the layout model uses explicit port nodes, those are the extremal points in the control point sequence, namely controlPoint[0] and controlPoint[i-1].
Manipulation of arc routings is somewhat tricky: Currently, control points cannot be assigned independently from arc label anchor points. Use the most high-level operation sparseRepresentation::InsertArcControlPoint() which still has some side effects: It will implicitly allocate and position an arc label anchor point if it does not exist in advance.
By default, bounding intervals are the extremal coordinate values augmented by the node spacing parameter value, and thus computed dynamically. The drawback of this rule is, that the bounding intervals can change dynamically with the graph nodes. In particular, for proper subgraphs, different intervals result.
To fix up such behavior, sparse graph objects can maintain two layout nodes which denote the upper-left and lower-right corner of the bounding box. The coordinates refer to the same metric space as the graph node coordinates.
If the current bounding box is as desired, and should stay unchanged with subsequent modifications of the graph or its drawing, just call abstractMixedGraph::Layout_FreezeBoundingBox(). There is also a method abstractMixedGraph::Layout_ReleaseBoundingBox() to revert to the dynamic bouding box computation.
All layout codes and most graph constructors (in particular, the copy constructors) set up a fixed bounding box.
In case of circular or radial drawings, the bounding box is the tight square around the bounding sphere.
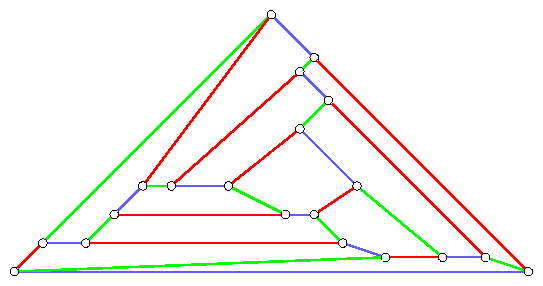
The library comes up with a method for convex drawing of triconnected planar graphs. This method has been be extended to arbtrirary planar graphs by making the input graph triconnected, then applying the convex drawing method and mapping back the node placement to the original graph. The final drawing probably has non-convex faces even if the input graph is triconnected, since graphs are actually triangulated. It is recommended either to apply the convex method directly or to use the restricted force directed placement (FDP) method for post-precessing.
The following is a convex drawing of the dodecahedron. The good resolution of area and angles stems from the regularity of the input graph:

There is another specialization of the circular method which travels around the exterior face of a planar graph. It is restricted to the class of outerplanar graphs. This denotes all graphs which have a plane drawing with all nodes on the exterior face. The outerplanar Planar representation representation must be given in advance.
The next two figures show the same outerplanar graph, starting with the single circular drawing:

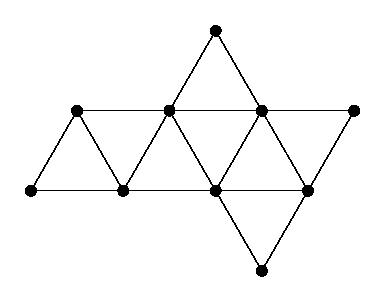
Some biconnected outerplanar graphs also admit an equilateral drawing. In that drawing, all nodes of a single interior face form a regular polyhedron. Observe that all equilateral drawings of a graph are congruent. A plane drawing results only in special cases. The original intent was to obtain paper models of Platonian and Archimedian polyhedra. For this purpose, there is another method to cut triconnected planar graphs along the edges of some spanning tree. What follows, is an example of such a paper model, obtained for the octahedron:

There are various specializations of this general orthogonal grid drawing model. Most refer to the output of particular drawing algorithms, and usually restrict the input graph somehow (planarity, connectivity, loops, parallels,..):
For the small-node model and for the Kandiski model, but not for the visibility-representation model, post-optimization procedure exist. By that, grid lines can be merged and nodes can move from one grid line to an adjacent line, but only if this reduces the number of control points or the total edge length. The effects are tremendous, but the final drawings are still far from optimal, especially in terms of the required area.
The following is a small node drawing of a dodekahedron. The library does not provide an exact method for bend minimization, but it is easy to see that this particular drawing is bend-minimal:

This figure has not been generated automatically, but by using the interactive Kandinski method. Although the procedure does not mind plane or small-node drawings, it is helpful for post-processing such drawings!
The following figure has been obtained from applying the staircase method to the dodecahedron without any post-proceesing. In this example, the post optimization code would reduce the area by a factor of 10.3 (to the same area as in the previous drawing), and the number of bends by a factor of 5.0 (two more bends than in the optimal solution above):

An example of a visibility representation can be found with the description of series-parallel graphs.

Trees with high degree nodes can be drawn in the 1-bent Kandinski model. As in the binary case, parent nodes appear in the upper left corner of the spanned subtree bounding box. Other than for HV-trees, child nodes are always displayed below of the parent nodes.
The optimization goals in the vertical placement step are the aspect ratio and the total edge span (this denotes the number of required control points). If the graph is directed or mixed, it is also intended to orient the arcs top-down. The goals in the horizontal placement are to prevent from edge crossings and to maximize the slopes of the edge segments.
Although it is a couple of more or less independent tools, the layered drawing code is called through a single interface function. If LAYERED_DEFAULT is specified, the graph is drawn from scratch. One should not expect plane or even upward-plane drawings for planar graphs. The main reason is that the crossing minimization code does not question the layer assignment done in advance.
Frankly, the rules which code is applied under which conditions are complicated:
In order to refine a given plane drawing, one should specify LAYERED_EDGE_SPAN and a method for horizontal placement, but skip the crossing minimization step. If no implicit top-down orientation has been computed in advance and delivered by the edge colours, the orientation is chosen as for the current drawing. It is not required that the previous drawing is in the layered model, but on the other hand, nodes might move vertically.
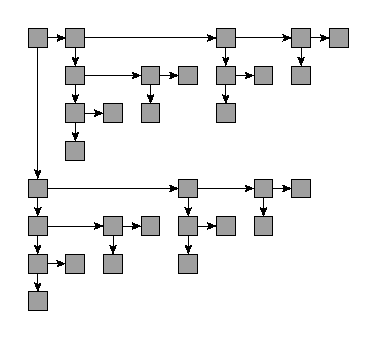
The following shows an edge span minimum upward drawing of upward planar digraph. This has been obtained in the default mode. In order to obtain a plane drawing, one node must be shifted manually to the next layer. But even then, the crossing minimization code would not clean up all edge crossings automatically:
